
Vehicles
South Carolina households own an average of 1.9 vehicles, with about 4.7 million vehicles registered statewide.
Households without a vehicle
2006–2024Census American Community Survey 1-year estimates, B08201 (2020 not released).
- •South Carolina does not require annual vehicle safety inspections, unlike many neighboring states.
Public Transit
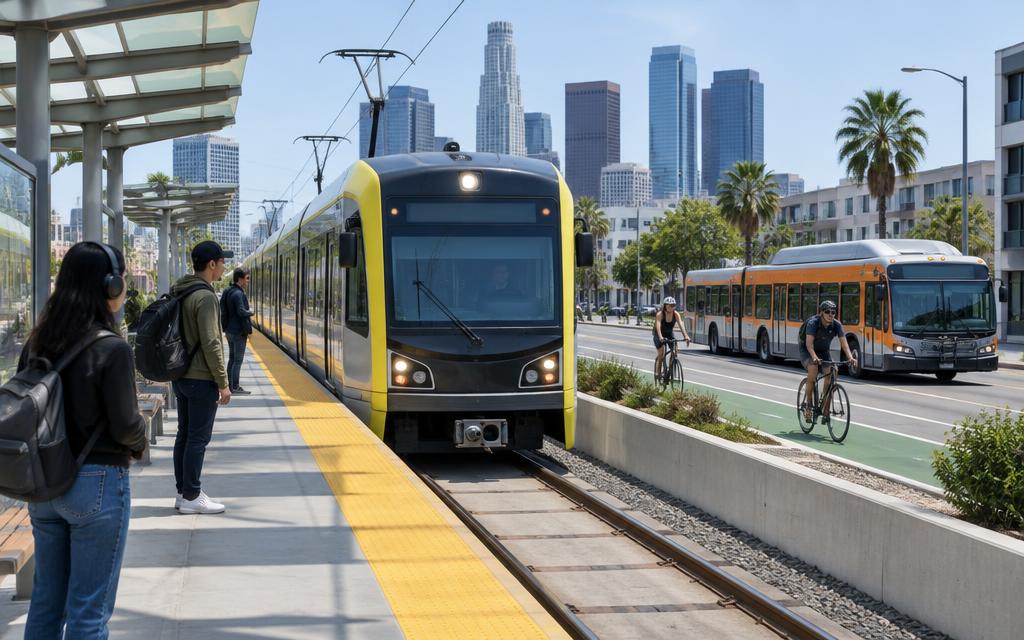
Less than 1% of South Carolina commuters use public transit, reflecting the state's heavily car-dependent infrastructure.
Workers commuting by public transit
2006–2024Census American Community Survey 1-year estimates, share of workers 16+, B08301 (2020 not released).
| Indicator | South Carolina | U.S. |
|---|---|---|
| Transit Commute Share | 0.5 | 3.1 |
- •CARTA, Charleston's regional transit authority, has expanded express bus routes to serve growing suburban commuters.
Airports
Charleston International is the busiest airport in South Carolina, followed by Greenville-Spartanburg and Myrtle Beach.
Passengers boarded at all commercial airports in South Carolina
2011–2025FAA Air Carrier Activity Information System, calendar-year commercial-service enplanements.
Passengers boarded at Charleston AFB/International (CHS)
2011–2025FAA calendar-year enplanements.
Traffic
South Carolina commuters average about 25 minutes, with congestion growing fast in Charleston and the Upstate.
Traffic fatalities
1994–2024NHTSA Fatality Analysis Reporting System (FARS), State Traffic Data.
Fatality rate per 100 million vehicle miles
1994–2024NHTSA Fatality Analysis Reporting System (FARS), State Traffic Data.
| Indicator | South Carolina | U.S. |
|---|---|---|
| Average commute (min) | 25 | 26.8 |
Commuting Patterns
South Carolina commuters spend an average of 24.8 minutes traveling to work, mostly driving alone.
Mean travel time to work
2006–2024Census American Community Survey 1-year estimates, aggregate travel time ÷ workers not working at home, B08013/B08012 (2020 not released).
Workers who drive alone
2006–2024Census American Community Survey 1-year estimates, share of workers 16+, B08301 (2020 not released).
Workers who work from home
2006–2024Census American Community Survey 1-year estimates, share of workers 16+, B08301 (2020 not released).
| Indicator | South Carolina | U.S. |
|---|---|---|
| Mean Commute Time (minutes) | 24.8 | 26.7 |
- •Charleston's commute times have lengthened significantly over the past decade due to the region's rapid population growth.
Infrastructure
South Carolina's transportation network includes about 850 interstate highway miles and the Port of Charleston, one of the nation's busiest container ports.
Bridges in poor condition
2000–2025FHWA National Bridge Inventory, Bridge Condition by Highway System (as of June each year).
Bridges in good condition
2000–2025FHWA National Bridge Inventory, Bridge Condition by Highway System (as of June each year).
Total highway bridges
2000–2025FHWA National Bridge Inventory, Bridge Condition by Highway System (as of June each year).
Vehicle miles traveled
1994–2024FHWA vehicle miles traveled as published with NHTSA FARS (fatalities ÷ fatality rate per 100M VMT).
- •The Port of Charleston can accommodate some of the largest container ships calling on the U.S. East Coast thanks to its deep harbor.