
Vehicles
Rhode Island has about 830,000 registered vehicles, serving a population of roughly 1.1 million residents across a dense but relatively small road network.
Households without a vehicle
2006–2024Census American Community Survey 1-year estimates, B08201 (2020 not released).
| Indicator | Rhode Island | U.S. |
|---|---|---|
| Registered vehicles | 830000 | 283400000 |
- •Despite being the smallest U.S. state by area, Rhode Island has hundreds of thousands of registered vehicles on its roads.
Public Transit
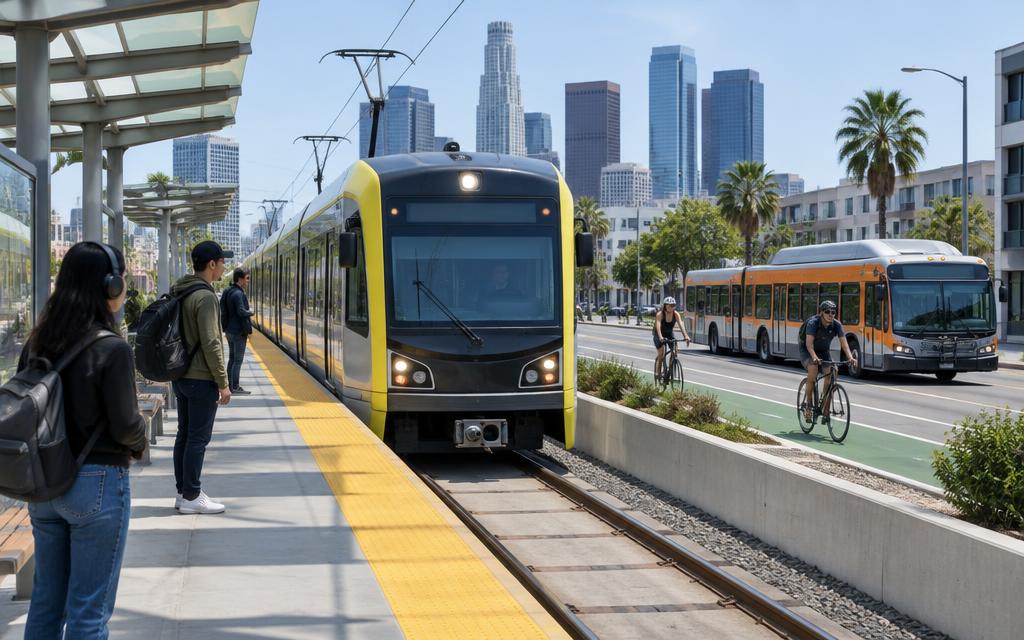
Public transit, operated primarily by RIPTA, accounts for about 2.4% of commute trips in Rhode Island, serving Providence and surrounding communities via bus routes.
Workers commuting by public transit
2006–2024Census American Community Survey 1-year estimates, share of workers 16+, B08301 (2020 not released).
| Indicator | Rhode Island | U.S. |
|---|---|---|
| Public transit commute share (%) | 2.4 | 5 |
- •RIPTA is one of the few U.S. transit systems that is entirely statewide rather than city-based.
Airports
T. F. Green International Airport (PVD) is Rhode Island's main air travel hub, serving about 4.1 million passengers in 2023 with flights across the East Coast.
Passengers boarded at all commercial airports in Rhode Island
2011–2025FAA Air Carrier Activity Information System, calendar-year commercial-service enplanements.
Passengers boarded at Rhode Island Tf Green International (PVD)
2011–2025FAA calendar-year enplanements.
| Indicator | Rhode Island | U.S. |
|---|---|---|
| Annual passengers (millions) | 4.1 | 853 |
- •T. F. Green Airport is named after a former Rhode Island governor and U.S. senator.
Traffic
Traffic congestion in Rhode Island centers on the Providence metro area and I-95 corridor, contributing to the state's average commute time of 25.7 minutes.
Traffic fatalities
1994–2024NHTSA Fatality Analysis Reporting System (FARS), State Traffic Data.
Fatality rate per 100 million vehicle miles
1994–2024NHTSA Fatality Analysis Reporting System (FARS), State Traffic Data.
| Indicator | Rhode Island | U.S. |
|---|---|---|
| Average commute time (minutes) | 25.7 | 26.4 |
- •The Providence I-95/I-195 interchange is consistently ranked among the most congested points in the Northeast.
Commuting Patterns
The average commute in Rhode Island takes about 25.7 minutes, with most workers driving alone amid a dense, urbanized road network connecting Providence and surrounding cities.
Mean travel time to work
2006–2024Census American Community Survey 1-year estimates, aggregate travel time ÷ workers not working at home, B08013/B08012 (2020 not released).
Workers who drive alone
2006–2024Census American Community Survey 1-year estimates, share of workers 16+, B08301 (2020 not released).
Workers who work from home
2006–2024Census American Community Survey 1-year estimates, share of workers 16+, B08301 (2020 not released).
| Indicator | Rhode Island | U.S. |
|---|---|---|
| Average commute time (minutes) | 25.7 | 26.4 |
- •Rhode Island's small size means even cross-state commutes rarely exceed an hour.
Infrastructure
Rhode Island maintains about 10,700 km of roadways, but 19% of its bridges are rated structurally deficient, among the worst rates in the nation.
Bridges in poor condition
2000–2025FHWA National Bridge Inventory, Bridge Condition by Highway System (as of June each year).
Bridges in good condition
2000–2025FHWA National Bridge Inventory, Bridge Condition by Highway System (as of June each year).
Total highway bridges
2000–2025FHWA National Bridge Inventory, Bridge Condition by Highway System (as of June each year).
Vehicle miles traveled
1994–2024FHWA vehicle miles traveled as published with NHTSA FARS (fatalities ÷ fatality rate per 100M VMT).
| Indicator | Rhode Island | U.S. |
|---|---|---|
| Bridges in poor condition (%) | 19 | 7.5 |
- •Rhode Island consistently ranks near the bottom nationally for bridge condition, despite its small road network.