
Vehicles
Households in Connecticut own an average of 1.8 vehicles, per 2023 Census ACS estimates.
Households without a vehicle
2006–2024Census American Community Survey 1-year estimates, B08201 (2020 not released).
- •Vehicle ownership rates in Connecticut tend to be higher outside its major urban centers.
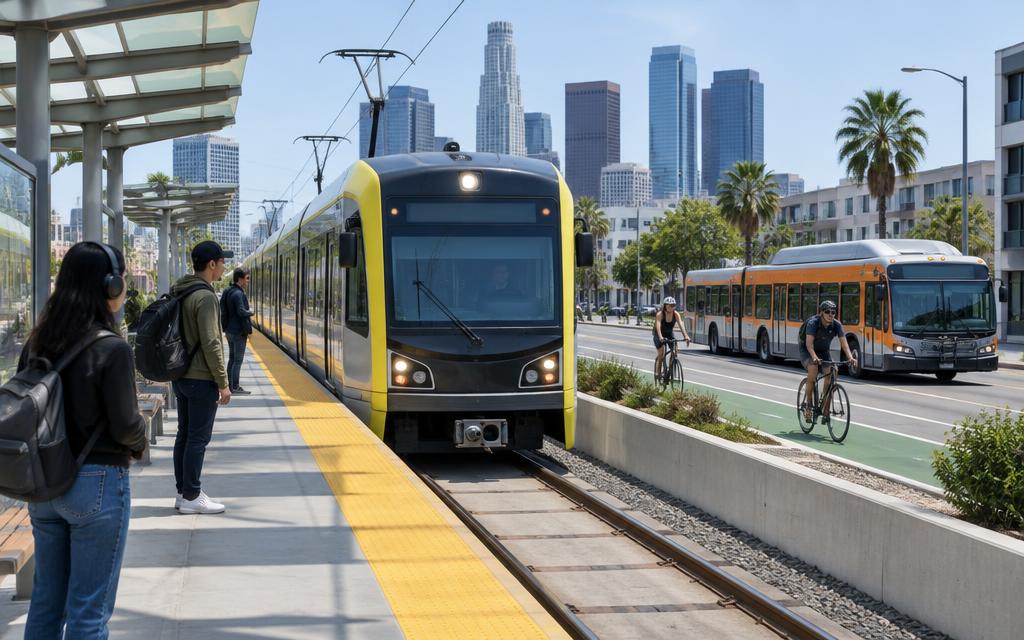
Public Transit
Only about 4.6% of Connecticut workers commuted via public transit in 2023.
Workers commuting by public transit
2006–2024Census American Community Survey 1-year estimates, share of workers 16+, B08301 (2020 not released).
- •Public transit usage in Connecticut is concentrated mainly in its largest metropolitan areas.
Airports
Bradley International near Hartford is Connecticut’s main airport, though many residents use New York-area hubs.
Passengers boarded at all commercial airports in Connecticut
2011–2025FAA Air Carrier Activity Information System, calendar-year commercial-service enplanements.
Passengers boarded at Bradley International (BDL)
2011–2025FAA calendar-year enplanements.
Traffic
Connecticut commuters average about 27.5 minutes, with heavy congestion on I-95 and the Merritt Parkway.
Traffic fatalities
1994–2024NHTSA Fatality Analysis Reporting System (FARS), State Traffic Data.
Fatality rate per 100 million vehicle miles
1994–2024NHTSA Fatality Analysis Reporting System (FARS), State Traffic Data.
| Indicator | Connecticut | U.S. |
|---|---|---|
| Average commute (min) | 27.5 | 26.8 |
Commuting Patterns
Connecticut's average one-way commute time was 25.9 minutes in 2023, per Census ACS data.
Mean travel time to work
2006–2024Census American Community Survey 1-year estimates, aggregate travel time ÷ workers not working at home, B08013/B08012 (2020 not released).
Workers who drive alone
2006–2024Census American Community Survey 1-year estimates, share of workers 16+, B08301 (2020 not released).
Workers who work from home
2006–2024Census American Community Survey 1-year estimates, share of workers 16+, B08301 (2020 not released).
| Indicator | Connecticut | U.S. |
|---|---|---|
| Average Commute (min) | 25.9 | 26.4 |
- •Commuting patterns in Connecticut reflect the balance between urban centers and outlying suburbs.
Infrastructure
Connecticut's transportation infrastructure supports an average of 1.8 vehicles per household as of 2023.
Bridges in poor condition
2000–2025FHWA National Bridge Inventory, Bridge Condition by Highway System (as of June each year).
Bridges in good condition
2000–2025FHWA National Bridge Inventory, Bridge Condition by Highway System (as of June each year).
Total highway bridges
2000–2025FHWA National Bridge Inventory, Bridge Condition by Highway System (as of June each year).
Vehicle miles traveled
1994–2024FHWA vehicle miles traveled as published with NHTSA FARS (fatalities ÷ fatality rate per 100M VMT).
- •Connecticut continues to invest in road, bridge and transit infrastructure improvements.