
Historical data
Pick an indicator to see its long-run evolution.
Travel spending
2000–2023Visit California / Dean Runyan.
Travel Spending
Visitor spending reached a new California record in 2023.
Wages paid by hotels and other traveler accommodation
2014–2025BLS Quarterly Census of Employment and Wages, private ownership, annual average, NAICS 7211, total annual wages (an indicator of visitor activity, not total spending).
Hotel and traveler accommodation jobs
2014–2025BLS Quarterly Census of Employment and Wages, private ownership, annual average, NAICS 7211.
Travel spending
2000–2023Visit California/Dean Runyan, nominal dollars.
| Indicator | California | U.S. |
|---|---|---|
| Travel spending2023 approximate U.S. direct spending | $150,400 million | $1,300,000 million |
- •California has nine national parks, more than any other state (National Park Service).
- •Golden Gate National Recreation Area drew nearly 15 million recreational visits in 2023—far more than any single California national park (NPS).
- •Statewide travel spending surpassed its pre-pandemic 2019 record in 2023 (Visit California).
Tourism Employment
Travel-supported work recovered close to its pre-pandemic level in 2023.
Leisure and hospitality jobs
1990–2025BLS Current Employment Statistics, annual average (FRED CALEIH).
| Indicator | California | U.S. |
|---|---|---|
| Tourism-supported employment2023 approximate national total | 1,150,000 | 15,000,000 |
- •California has nine national parks, more than any other state (National Park Service).
- •Golden Gate National Recreation Area drew nearly 15 million recreational visits in 2023—far more than any single California national park (NPS).
- •Statewide travel spending surpassed its pre-pandemic 2019 record in 2023 (Visit California).
Tourism Tax Revenue
Visitor activity generates substantial state and local tax receipts.
| Indicator | California | U.S. |
|---|---|---|
| State and local tourism taxesApproximate 2023 national total | $12,700 million | $89,000 million |
- •California has nine national parks, more than any other state (National Park Service).
- •Golden Gate National Recreation Area drew nearly 15 million recreational visits in 2023—far more than any single California national park (NPS).
- •Statewide travel spending surpassed its pre-pandemic 2019 record in 2023 (Visit California).
International Visitors
International travelers account for a high-value part of California tourism.
| Indicator | California | U.S. |
|---|---|---|
| Recovery from 2018 peakVisit California | 85% | Not directly comparable |
- •California has nine national parks, more than any other state (National Park Service).
- •Golden Gate National Recreation Area drew nearly 15 million recreational visits in 2023—far more than any single California national park (NPS).
- •Statewide travel spending surpassed its pre-pandemic 2019 record in 2023 (Visit California).
National Parks
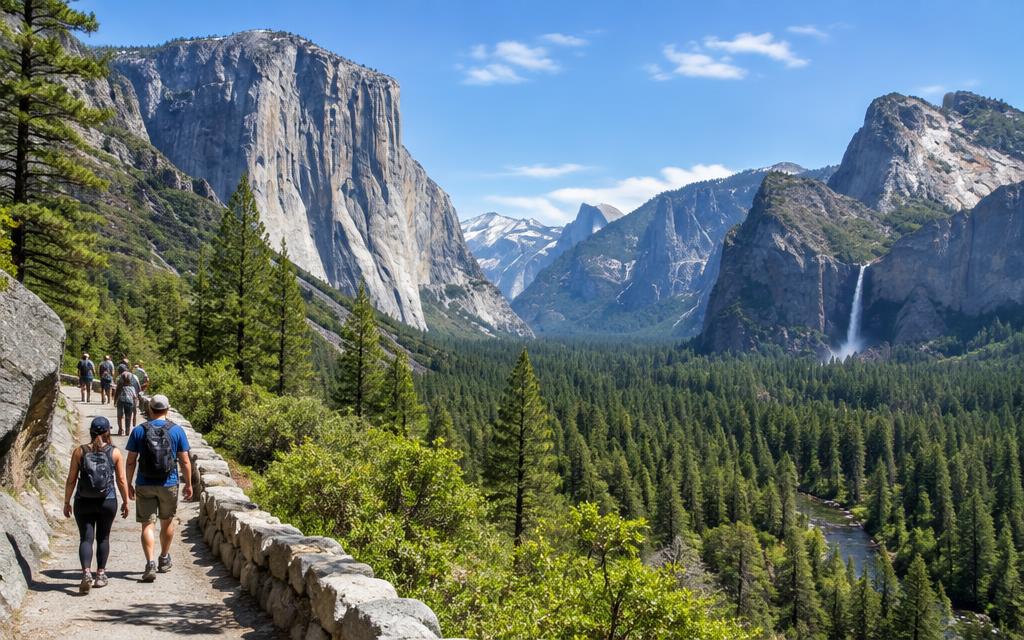
California has more national parks than any other state and several of the country's busiest NPS sites.
Recreation visits to California's national parks
1990–2025National Park Service, IRMA Visitor Use Statistics (recreation visits, calendar year). Yosemite, Sequoia & Kings Canyon, Joshua Tree, Death Valley, Redwood, Lassen Volcanic, Pinnacles and Channel Islands.
Yosemite National Park recreation visits
1990–2025National Park Service, IRMA Visitor Use Statistics (recreation visits, calendar year).
| Indicator | California | U.S. |
|---|---|---|
| National parksNPS | 9 | 63 nationwide |
- •California has nine national parks, more than any other state (National Park Service).
- •Golden Gate National Recreation Area drew nearly 15 million recreational visits in 2023—far more than any single California national park (NPS).
- •Statewide travel spending surpassed its pre-pandemic 2019 record in 2023 (Visit California).