
Historical data
Pick an indicator to see its long-run evolution.
Farm cash receipts
1980–2022USDA ERS, nominal.
Farm Cash Receipts
California leads every state in the market value generated by its farms.
Real GDP, agriculture, forestry & fishing
1997–2025BEA, chained 2017 dollars (FRED CAAGRRGSP).
Farm proprietors' income
1970–2025BEA state personal income, annual average of quarterly rates (FRED CAOFAR).
Farm cash receipts
1980–2022USDA ERS/CDFA, nominal dollars.
| Indicator | California | U.S. |
|---|---|---|
| Farm cash receipts2022 approximate U.S. total | $59,400 million | $543,000 million |
- •California grows more than 400 agricultural commodities, an unusually diverse farm portfolio (California Department of Food and Agriculture).
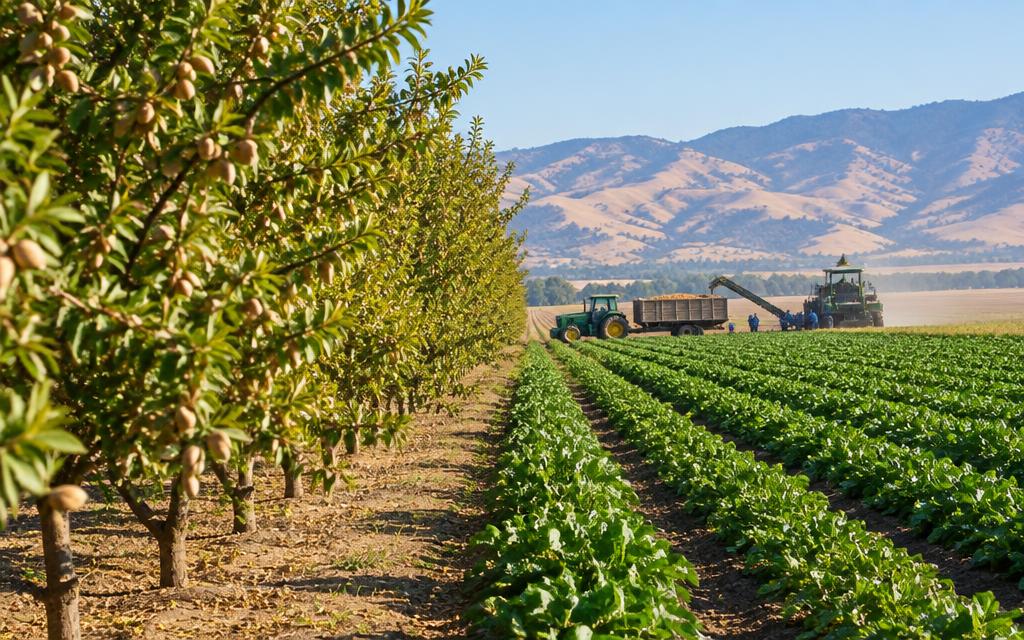
- •California produces more than one-third of U.S. vegetables and about two-thirds of U.S. fruits and nuts (CDFA).
- •California operates the only state organic program authorized as an organic certifier and enforcement program under the federal National Organic Program (CDFA).
Farms & Farmland
The 2022 Census of Agriculture counts California farms and the land they operate.
Number of farms
1993–2025USDA National Agricultural Statistics Service, Farms and Land in Farms survey (QuickStats).
Land in farms
1993–2025USDA National Agricultural Statistics Service, Farms and Land in Farms survey (QuickStats).
Average farm size
1993–2025Land in farms divided by number of farms, USDA NASS survey.
- •California grows more than 400 agricultural commodities, an unusually diverse farm portfolio (California Department of Food and Agriculture).
- •California produces more than one-third of U.S. vegetables and about two-thirds of U.S. fruits and nuts (CDFA).
- •California operates the only state organic program authorized as an organic certifier and enforcement program under the federal National Organic Program (CDFA).
Top Commodities
Dairy, grapes and almonds were California's three highest-value commodities in 2021.
Milk production value
1983–2025USDA National Agricultural Statistics Service, Milk Production, Disposition and Income (QuickStats).
Almond production value
1995–2025USDA National Agricultural Statistics Service, Noncitrus Fruits and Nuts, utilized shelled production (QuickStats).
Grape production value (all types)
2007–2025USDA National Agricultural Statistics Service, Noncitrus Fruits and Nuts, utilized production (QuickStats).
Wine grape production value
2007–2025USDA National Agricultural Statistics Service, Noncitrus Fruits and Nuts, wine-type grapes (QuickStats).
Cattle and calves inventory (January 1)
1867–2026USDA National Agricultural Statistics Service, Cattle inventory survey (QuickStats).
| Indicator | California | U.S. |
|---|---|---|
| U.S. vegetable production shareCDFA | More than one-third | 100% |
- •California grows more than 400 agricultural commodities, an unusually diverse farm portfolio (California Department of Food and Agriculture).
- •California produces more than one-third of U.S. vegetables and about two-thirds of U.S. fruits and nuts (CDFA).
- •California operates the only state organic program authorized as an organic certifier and enforcement program under the federal National Organic Program (CDFA).
Agricultural Exports
California farm exports connect its high-value crops with markets worldwide.
Total agricultural exports
2000–2024USDA Economic Research Service, State Exports, Cash Receipts Estimates (calendar year).
Tree nuts exports
2000–2024USDA Economic Research Service, State Exports, Cash Receipts Estimates (calendar year).
Dairy products exports
2000–2024USDA Economic Research Service, State Exports, Cash Receipts Estimates (calendar year).
Fruits, fresh exports
2000–2024USDA Economic Research Service, State Exports, Cash Receipts Estimates (calendar year).
Vegetables, fresh exports
2000–2024USDA Economic Research Service, State Exports, Cash Receipts Estimates (calendar year).
Total animal products exports
2000–2024USDA Economic Research Service, State Exports, Cash Receipts Estimates (calendar year).
| Indicator | California | U.S. |
|---|---|---|
| Agricultural exports2021 approximate U.S. total | $22,500 million | $177,000 million |
- •California grows more than 400 agricultural commodities, an unusually diverse farm portfolio (California Department of Food and Agriculture).
- •California produces more than one-third of U.S. vegetables and about two-thirds of U.S. fruits and nuts (CDFA).
- •California operates the only state organic program authorized as an organic certifier and enforcement program under the federal National Organic Program (CDFA).
Organic Agriculture
California is the country's largest organic farm market by sales.
Certified and exempt organic sales
2007–2022USDA National Agricultural Statistics Service, Census of Agriculture / Organic Survey (QuickStats).
Organic farms with sales
2007–2022USDA National Agricultural Statistics Service, Census of Agriculture / Organic Survey (QuickStats).
| Indicator | California | U.S. |
|---|---|---|
| Organic sales2021 approximate U.S. market | $14,000 million | $63,000 million |
- •California grows more than 400 agricultural commodities, an unusually diverse farm portfolio (California Department of Food and Agriculture).
- •California produces more than one-third of U.S. vegetables and about two-thirds of U.S. fruits and nuts (CDFA).
- •California operates the only state organic program authorized as an organic certifier and enforcement program under the federal National Organic Program (CDFA).